Article

Andrew Bailey’s Claims Rebutted

There is no shortage of ‘studies’ purporting to bear out the Establishment’s claims in 2016 that Brexit would do great damage to the UK economy. The number of studies and the media coverage accorded to them disguise the inconsistency in the size and nature of the claims: quantity is taken as proof of correctness, whereas content is unconvincing.

The area of consistency in the studies is that the authors consider the EU as a single, homogenous target market for UK exporters, a unitary economic area in which it is inferred that sales opportunities existed but were garnered by suppliers in other EU member states. Absent Brexit, UK suppliers would supposedly have captured these opportunities, raising the UK’s Gross Domestic Product (GDP). In addition, it is taken as read that a substantial amount of value would have been added in the UK, increasing the UK’s wealth, as opposed to the UK’s being used as a pass-through (like Ireland) or as a meeting point between the sales order and imported EU migrant labour, whose costs to the UK economy at best match the value their labour adds.

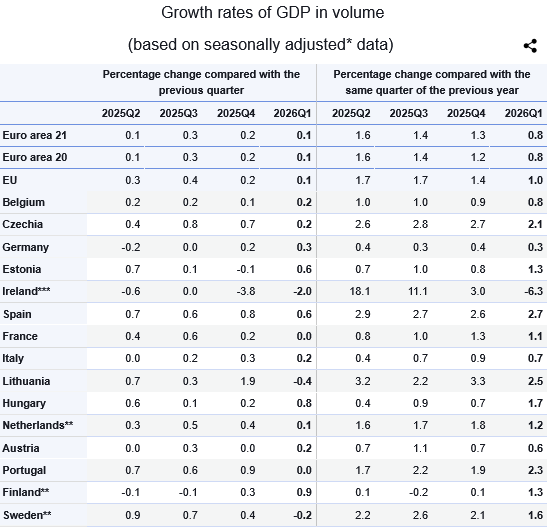
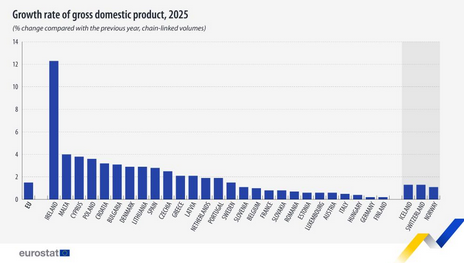
The EU’s own statistics, however, bear no sign that the UK missed out on sales opportunities in the quantity that Rejoiners claim. Indeed the divergence in the economic statistics of EU member states shows that the EU is not a single target market, but 27 different ones, with the Republic of Ireland being a particular outlier. Rejoiner claims fall down in front of realities about the EU Single Market: it has failed to produce the self- sustaining growth that its proponents promised.

Claims of Brexit damage to the economy

The large constituency determined to talk Brexit down fails to deliver figures that are convincing or consistent. Claims are estimates over different time periods, some declaring a linear damage, others a cumulative one, and in amounts ranging from 1% linear to 8% cumulative. The studies generally fail to go into the detail of whether their figures are of lost volume of sales into the EU, or of lost wealth. In the latter case, the assumptions are not stated that connect sales volume to wealth.1

Former foreign secretary David Miliband recently claimed that ‘Brexit was an act of “sabotage” that has made Britain up to £30bn a year worse off’.2 £30 billion is only 1% of UK
GDP, which is within a statistical margin of error. One has to assume therefore that Miliband is talking about lost wealth. His wording betokens a linear loss. The Office for Budget Responsibility (OBR) has made a much-quoted forecast of a ‘long-run’ reduction in the improvement of UK productivity attributable to Brexit, which they forecast would translate into an economy 4% smaller at the end of the period than it would have been without Brexit.3 The 4% is a cumulative figure, of sales volumes not wealth, and holds out that, whatever size the UK economy turns out to be, it would have been 4% bigger without Brexit. ‘Long-run’ is 15 years, meaning that the give-up per annum to the supposed improvements in both productivity and GDP is 0.2666%. This is based on an assumption that productivity and GDP would have both improved without Brexit in the first place, and that there is a linear relationship between productivity gain and GDP growth.4

Then we have the National Bureau for Economic Research (NBER) study, paid for by the UK taxpayer, which delivers the biggest number: an 8% loss of GDP, cumulative, of sales volumes not wealth, over a broadly similar timeframe as the OBR.5 The methodology of that study has been dissected by economist Julian Jessop.6 Its main failure was to include the
USA in the sample of economies that the UK was compared to: the study proved that the UK’s economic model remained similar to that of EU economies, but lagged behind the USA.
That is therefore not a failure of Brexit, but of a failure to capitalise on the Brexit opportunity to diverge from the EU economic model. The other distorting comparison derived from the inclusion of the Republic of Ireland, whose economy has been swollen by the recording of sales volumes of Irish subsidiaries of US-headquartered multinationals as being part of Irish GDP, when they are of a pass-through nature and little or no value is added to them in Ireland.

Now Bloomberg’s have emerged with their gloss on the NBER study, and have issued rival calculations that the proper number is 2.5%, cumulative, and of lost sales volumes.7

The Establishment trying to claim they were right all along

One way or another, these ‘studies’ are a re-hash of the HM Treasury ‘analysis’ of May 2016, with its foreword by Chancellor George Osborne, in which he chose to lay his emphasis on the materialization of the most severe adverse scenario that could result from Brexit: ‘GDP would be 6% smaller, there would be a deeper recession, and the number of people made unemployed would rise by around 800,000 compared with a vote to remain.’8

He stated that the analysis ‘showed that under any alternative relationship with Europe, we would trade less, do less business and receive less investment. Its central estimate was that Britain would be permanently poorer by the equivalent of £4,300 per household by 2030 and every year thereafter. Depending on the new relationship with the EU, these long-term costs
could be even larger.’

None of those things have happened but the Establishment will not have it. Instead its PR department – the BBC – has used the existence of this range of duplicative studies to fend off criticism of bias by saying that all economic commentators agree that Brexit has damaged the economy, and that the only area of disagreement is by how much.9

EU GDP performance

The concept of the EU as a single economic market for UK exporters to sell into is taken as a self-evident truth in the Rejoiner studies. The concept is undermined by the statistics of
member state performance issued by Eurostat.

Eurostat’s summary for the first quarter of 2026 is as follows: ‘Among the Member States for which data are available for the first quarter of 2026, Finland (+0.9%) recorded the highest increase compared to the previous quarter, followed by Hungary (+0.8%), Estonia and Spain (both +0.6%). Declines were recorded in Ireland (-2.0%), Lithuania (-0.4%) and Sweden (-0.2%). The year-on-year growth rate was positive for fourteen countries and negative for one country.’10

The performance compared to the preceding quarter contains a range of 2.9% from best (Finland) to worst (Ireland), or of 1.3% if one discounts Ireland as an outlier and takes Lithuania as the worst performer. On a year-on-year basis within the 27 member states, 14 experienced annual growth, 1 experienced annual contraction, inferring the other 12 experienced neither growth nor contraction but stagnation.

This does not add up to a Single Market.

Figure 1: Growth rates of GDP in volume (based on seasonally adjusted data)

What Rejoiner ‘studies’ infer should have been happening if the UK had still been in the EU

During 2025 and using the NBER projections pro-rata since 2020, the UK should have been selling around 2.5% more as a percentage of its own GDP into this area than it did. UK GDP
would have been £75 billion higher, which approximates to €85 billion, thanks to £75 billion of additional sales being made to buyers in countries in the Eurostat table above. The EU27’s GDP in 2025 was €18.0 trillion.11 The UK’s was €3.4 trillion.12 The EU-28’s GDP with the UK in it would have been €21.4 trillion. The putative €85 billion of additional UK sales was 0.47% of the EU-27 economy, or 0.40% of the EU-28 economy had the UK still been a member.

The key question is whether EU GDP would have remained at €21.4 trillion after UK exporters had booked their additional €85 billion of sales, or whether EU GDP would have risen to €21.5 trillion, because these sales would not have occurred at all unless the UK had been in the EU.

Put another way, the key question is the source of the additional sales:

  • Taken from the GDP of other member states as the sales of their suppliers are reduced in an equal-and-opposite amount to the sales captured by UK suppliers, resulting in EU-28 GDP remaining at €21.4 trillion?
  • Deriving from an incremental degree of demand across all EU economies stimulated by the Single Market’s being extended in size by 15%, causing EU-28 GDP to rise to €21.5 trillion?13

To the first option, Rejoiners cannot be certain that the value proposition of UK exporters presented to buyers in these 27 other EU countries would be superior to that offered to buyers by suppliers in their own member state or in one of the other 26.

Rejoiners’ contentions hang on the second option: that the Single Market’s being extended in size is meant to create an economic area that self-stimulates.

This is where their claims fall down, because the EU Single Market is not self-stimulating. It is neither a genuinely single market but a disparate one, and it is not it creating its own momentum: economic growth is low and unevenly distributed.

The outlier – the Republic of Ireland

Ireland is the outlier within the EU’s figures, as Eurostat’s chart of GDP growth in 2025 demonstrates:14

Figure 2: Eurostat, Growth rate of gross domestic product (GDP), 2025, EU27 + EEA EFTA

Allegedly this was connected with the anticipated imposition of trade tariffs by the subsidiaries of US-headquartered multinationals, whereby these companies were able to accelerate sales, probably because their direct trading partner was a sister subsidiary of the same ultimate parent company. The decision whether to buy or not was to do with timing, not substance, and the group of companies could control the timing amongst themselves.

That in itself illuminates how much of Ireland’s cross-border trade is conducted between sister subsidiaries of the same ultimate parent company based in the USA. Business is dog-legged through Ireland for invoicing and tax purposes, without any of the goods necessarily passing through there, or any value being added there.

Already in 2017 this was diverting £10 billion per annum of UK GDP such that it was being counted as Irish GDP. 15 This diversion of GDP was reflected in the difference of €113 billion in 2017 between Irish GDP as recorded of €294 billion and the lower figure for the output of the Irish economy (what was made and performed there) of €181 billion. The lower measure is known as Gross National Income or GNI. 16 In other words €113 billion of economic activity was invoiced out of Ireland without any value having been added there. In addition, a portion of the €181 billion was attributable to subsidiaries of US companies where some value was added in Ireland.

Corporation tax paid by subsidiaries of US companies, and why it is so low as a percentageof their sales

In 2025 subsidiaries of US companies paid €15 billion in corporation tax - 46% of all of Ireland’s corporation tax receipts of €33 billion.17 Ireland’s corporation tax receipts in 2015 were €6 billion, and let’s assume that this had moved up to €8 billion by 2017, and that half of that came from the subsidiaries of US companies. If tax receipts from this source were €4 billion, and the rate at which tax was levied was 12.5%, the taxable profit that delivered those tax receipts was €32 billion.

The sales of the subsidiaries of US companies will have been the €113 billion difference between GDP and GNI, plus a portion of the GNI: let’s say €140 billion of sales in total. This €140 billion will have been shrunk down to the pre-tax profit of €32 billion, by legitimate and direct business costs firstly, and then by generating further tax-deductible charges. The legitimate and direct business costs can be substantial where genuine activity is being carried out, but they will be far lower on pass-through business – the €113 billion.

Artificial techniques are then required for shrinking the taxable profit down to the desired level. These were examined in ‘The Celtic Paper Tiger’:18

  • Deduction of invoices for services rendered by sister subsidiaries in low-tax or 0%-tax jurisdictions, for items such as usage of intellectual property assets (patents, logos, recipes). Revenue services would normally seek to challenge such deductions where they could not be robustly founded, but it is part-and-parcel of the Irish scheme that there is no objection to these deductions;
  • Depreciation of aircraft under tax-leveraged leases, Ireland being home to 70%+ of the world’s commercial airliners, although very few ever go there. The Irish subsidiary of a US multinational is permitted to engage in this industry despite its own Standard Industry Code (SIC) being for Information Technology, Biotechnology, or Pharmaceuticals. It is permitted to depreciate the entire aircraft and over 8 years to a 0% residual value, despite their injecting only 10-15% of the aircraft’s cost, and despite the aircraft having a useful life of at least 15 years with a residual value at that point of 10-20% of its original cost.19

We can simulate the tax return for the entirety of the sector of subsidiaries of US companies in 2017 as follows:

Sales€140 billion
Less legitimate and direct business costs€44 billion
Operating profit€96 billion
Less invoices for services rendered by sister subsidiaries€34 billion
Profit from activities within the corporate SIC code€62 billion
Less depreciation charges on aircraft€30 billion
Taxable profit€32 billion
Tax payable at 12.5%€4 billion
Post-tax profit€28 billion

This meets the claim that corporation tax in Ireland is levied at an effective rate of around 4% of the genuine business profit, which is €96 billion in the above table: sales of €140 billion less €44 billion of legitimate business costs.

Such are the techniques required in the EU economic model to record high growth: accounting trickery, stealing GDP from other member states, accreting taxable revenues to oneself and then not taxing them, depleting the resources that other member states have at their disposal to pay for public services.

The rapid expansion of Irish GDP between the illustrated year of 2017 and 2025 has been based on this business model. The fact that subsidiaries of US companies paid €15 billion of corporation tax in 2025 compared to €4 billion in 2017 in our simulation points to an activity level of nearly 400% of what was in place in 2017.

Conclusions

The studies produced by Rejoiners and the Establishment on Brexit’s supposed damage to the economy are in equal measure divergent from one another, mutually contradictory, and desperately trying to prove retrospectively that HM Treasury’s warning about the immediate and severe economic consequences of Brexit have come true, or will still come true, even if
they have not been immediate.

The plausibility of this line of argument falls apart in the face of the actual economic performance of the EU itself: not a single market, low growth rates, no self-sustaining momentum, no realistic chance that the re-addition of the UK economic area would unlock the growth that the EU economic area fails to trigger under its own steam.

The NBER study showed what could have been achieved from Brexit in terms of the superior performance of the US economic model.

The NBER over-weighted Ireland as an EU economy showing the level of growth that the UK had supposedly missed out on, even though around 40% of Ireland’s economy has little-or- nothing to do with Ireland, and has been dog-legged through there for tax purposes. The UK has taken no steps to interdict this abuse since Brexit regarding Ireland – or regarding the analogous scheme operated by Amazon through Luxembourg. Given a base in 2017 of £10-12 billion per annum in lost GDP and the expansion of Amazon and of the usage of Ireland by other US companies since then, the UK’s give-up of GDP to these abusive schemes could by now be £40-50 billion per annum, or 1.3-1.6% of our GDP.

That is a Brexit benefit which has been spurned so far, and bears comparison with what Rejoiners claim has been lost.

These abuses, though, represent the most spectacular examples of GDP growth in the EU, given that the core EU economic model has failed to deliver either robust GDP growth or a genuine single market. The EU has failed, as Brexiteers have contended, to succeed against its own terms of reference. Brexiteers can be rightly annoyed at the EU, for both enclosing
such a large swathe of the Western capitalist economic area, and then driving it into the sand.

References

  1. This depends on the business model, how much value is added in the UK on the lost sales, and whether that value remains within the UK
  2. https://www.independent.co.uk/news/uk/politics/brexit-cost-eu-uk-david-miliband-b2979506.html accessed on 15 June 2026
  3. https://obr.uk/box/how-are-our-brexit-forecasting-assumptions-performing/ accessed on 15 June 2026
  4. https://www.lyddonconsulting.com/is-there-a-common-understanding-of-the-obr-statement-in-2021-that-brexit-would-cause-a-long-run-4-loss-of-gdp/ accessed on 15 June 2026
  5. https://www.nber.org/papers/w34459 accessed on 15 May 2026
  6. https://julianhjessop.substack.com/p/three-reasons-why-you-should-never accessed on 15 June 2026
  7. https://britain-unbound.org/news/bloomberg-debunks-the-nber-8/ accessed on 15 June 2026
  8. p.8 of ‘HM Treasury analysis: the immediate economic impact of leaving the EU’ Cm9292 of May 2016
  9. https://tce.exchange/content/019ebcd0-3f90-7710-a240-5d6df6a6d561?variant=origin accessed on 15 June 2026
  10. https://ec.europa.eu/eurostat/web/products-euro-indicators/w/2-30042026-bp accessed on 15 June 2026
  11. https://www.statista.com/statistics/527869/european-union-gross-domestic-product-forecast/ accessed on 15 June 2026 and using an exchange rate for USD/EUR of 0.85
  12. Assuming UK GDP to have been £3 trillion and the GBP/EUR exchange rate to have been 1.14
  13. 15% is the approximate size of UK GDP compared to EU GDP if the UK were still a member
  14. https://ec.europa.eu/eurostat/web/products-eurostat-news/w/ddn-20260306-3 accessed on 15 June 2026
  15. https://www.lyddonconsulting.com/the-uks-lost-gdp-and-tax-revenues/ accessed on 15 June 2026
  16. P. 10 of ‘The Irish Economic Miracle – Fact or Fiction?’ by Ewan Stewart and Bob Lyddon see https://www.lyddonconsulting.com/the-irish-economic-miracle-fact-or-fiction/ accessed on 15 June 2026
  17. https://www.lse.co.uk/news/three-multinationals-pay-almost-half-of-all-irish-corporate-tax-watchdog-says-40cgizwzfpcp9yv.html accessed on 15 June 2026
  18. https://www.lyddonconsulting.com/the-celtic-paper-tiger/ accessed on 15 June 2026
  19. Aircraft useful life and residual value are both variable, depending principally on the number of cycles (a take-off and a landing). An aircraft on short-haul might do 10 cycles a day whereas one on non-stop long-haul might only do 1 cycle per day.
Bob Lyddon
Bob Lyddon

Bob runs his own management consultancy in finance and banking, and is an expert on the off-balance-sheet financing mechanisms of the EU, and the threat they pose both to EU member states and to the global financial system. He has also written on the total cost of EU membership, the UK’s residual liabilities to the EU after Brexit, and the hidden subsidies afforded by the UK to other member states due to Freedom of Movement and Freedom of Incorporation, which remain ongoing. Bob holds a Cambridge B.A. First in Modern languages and an Open University M.A. Distinction in History.